Real numbers from real clinic campaigns
Every figure below comes from a live campaign. No aggregated averages, no cherry-picked outliers — cost-per-booked-appointment, vertical by vertical.
Aggregate performance benchmarks
$34
4,800+
6.2×
91%
Average cost per booked appointment across all clinic types and platforms.
Patient appointments generated for clinic partners in the last 12 months.
Median return on ad spend measured in confirmed chair-side revenue, not form fills.
Of active clinic partners renewed their campaigns beyond the first 90-day period.
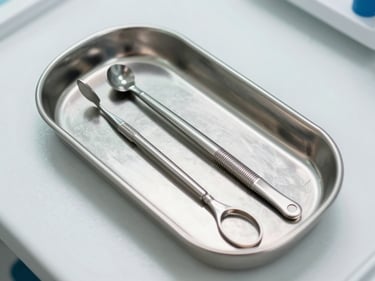
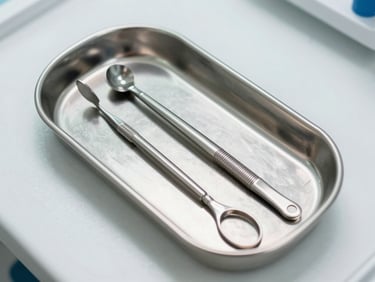
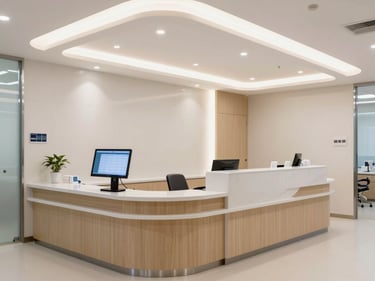
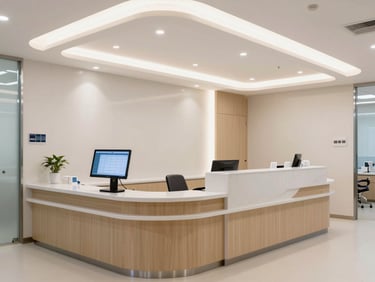
Cost-per-appointment, broken down
$28 per booked appointment
$41 per booked appointment
$22 per booked appointment
$47 per booked appointment
Meta Ads targeting injectables and laser treatments. 312 appointments over 60 days. Show rate: 84%.
Google Search Ads for implants and Invisalign. 198 appointments in 45 days. Average ticket: $1,400.
Meta and Google combined. 540 appointments over 90 days targeting post-surgical and sports injury segments.
Google Ads across four specialty departments. 224 appointments in 30 days. CPL dropped 38% by month two.
One standard across every platform
Whether the campaign runs on Meta or Google, we track a single output: the confirmed appointment on your calendar. Click-through rates and form submissions don't appear in our reports.
Every case study above reflects the same tracking methodology — call-tracked, CRM-verified, no self-reported data.
See what these numbers look like for your clinic
Bring your current ad spend and patient volume. We'll show you a projected cost-per-appointment before any commitment.